Assessing net economic and environmental impacts of AI-powered microgrids up to 2035 with Schneider Electric

Mission
The teams at Schneider Electric’s Sustainable Research Institute have asked us to assess the net benefits of an AI solution deployed to improve the management of the microgrids the company is installing around the world.
The sole aim of this AI solution is to reduce energy costs at sites equipped with microgrids. Our main questions were therefore: do the economic benefits translate into environmental benefits, and if so, under what conditions?
Method
We followed the methodologies for assessing net environmental impacts in which we are experts: ITU-T L.1480 and the EGDC’s Net Carbon Impact Assessment.
In general terms, these methods involve defining the solution, the implementation context, the baseline scenario and the environmental impacts of the solution.
| Scope | Single ICT solution in several specific contexts |
| Perspective | Company’s perspective on an ICT solution across multiple sites |
| Context | Local energy grid where the solution is deployed |
| Solution deployment | 11 operational sites (Europe, US, Australia), with primary data from EcoStruxure™ Microgrid Advisor systems |
| Temporal perspective | Mid-way (2 years of primary data from 2023 to 2024, ex-ante prospective from 2025 to 2035) |
| Reference scenario | (i) Self-consumption microgrid (reference scenario); (ii) grid-only (counterfactual scenario) |
| Assessment depth | Direct, indirect and higher-order effects identified; only those for which primary data and sufficiently constrained uncertainty estimates were available have been quantified |
| Environmental criteria | 16 environmental criteria considered |
Data
We based our analysis primary operational data from 11 sites spread across three continents on a 2-year period. The data obtained includes: electricity flows, battery state-of-charge, and dispatch commands.
| PV (kW) | BESS (kWh) | |
|---|---|---|
| 1-AUS | 2,500 | 3,516 |
| 2-CZ | 77 | 120 |
| 3-FR | 116 | 51 |
| 4-FR | 897 | 300 |
| 5-BE | 200 | 300 |
| 6-BE | 300 | 480 |
| 7-US-CAL | 500 | 3,000 |
| 8-US-CAL | 146 | 1,142 |
| 9-US-CAL | 313 | 92 |
| 10-US-NW | 500 | 253 |
| 11-US-NW | 300 | 288 |
Scenarios
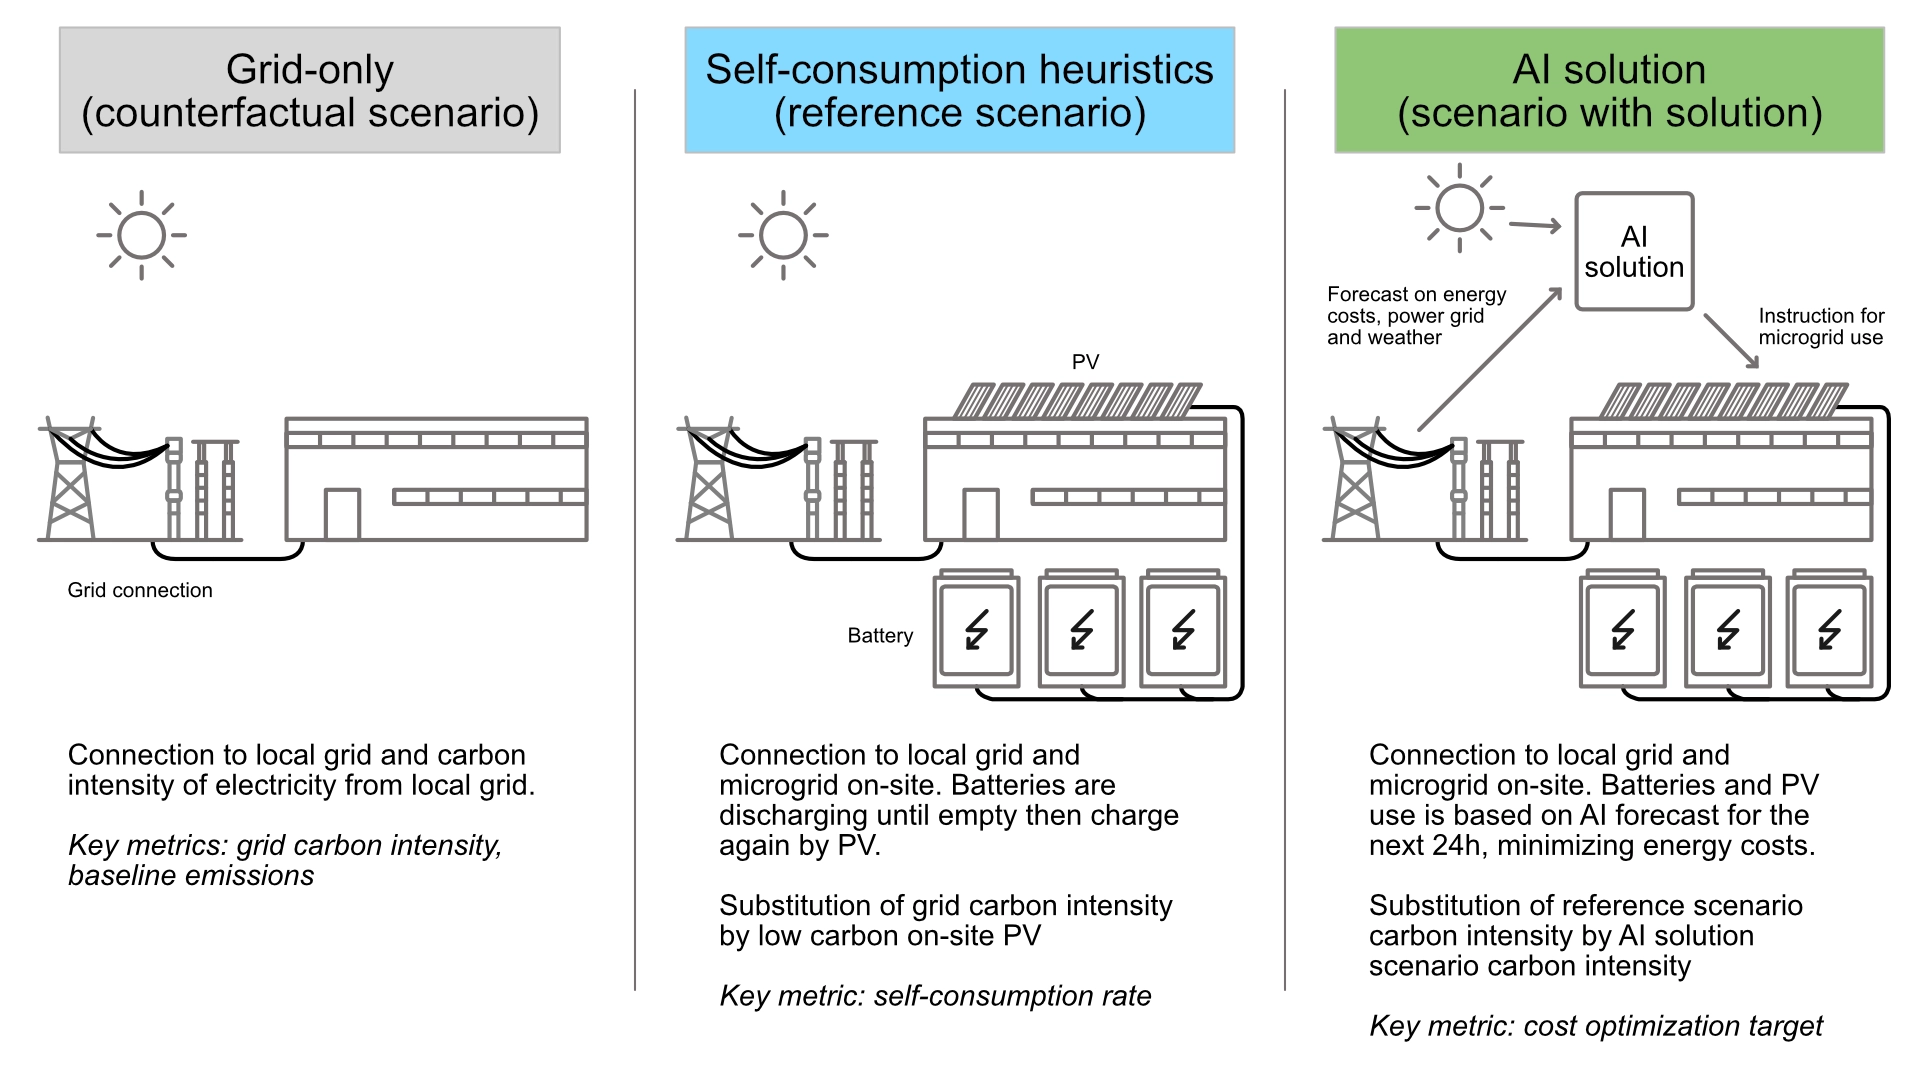
Broadly speaking, a microgrid is a site equipped with solar panels and storage batteries. By default, this microgrid is managed by a programme that enables self-consumption, storage and the import of electricity from the local electricity grid.
In this study, we focused solely on the effects of the AI solution on a site already equipped with a microgrid. The benefits of a microgrid in its own right are not taken into account but are assumed to be positive.
The two scenarios to be compared are therefore: a scenario involving a microgrid with its basic programme, which maximises self-consumption; and a scenario involving a microgrid controlled by the AI solution, which maximises the reduction in energy expenditure.
Consequences
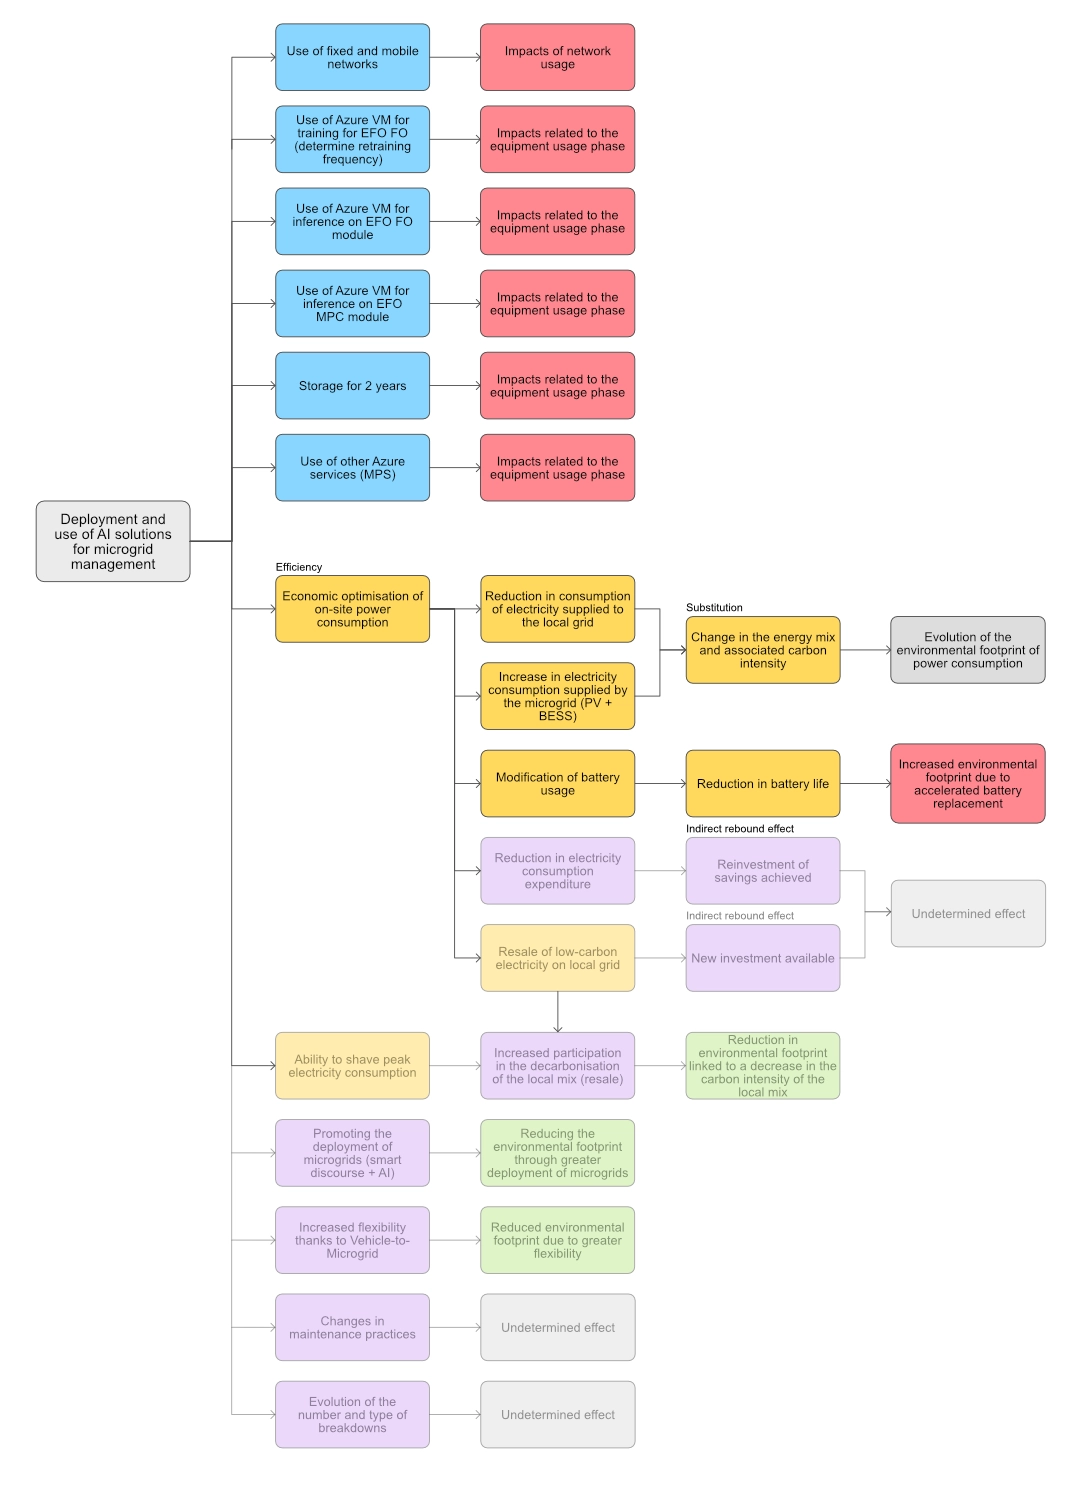
To map out the potential environmental consequences – both negative and positive – of a solution, we use a consequence tree.
This tree is usually drawn up during a workshop with stakeholders and aims to provide the most comprehensive map of known potential consequences. It also helps to determine whether each branch of the tree constitutes, at first glance, an environmental benefit or a burden.
In the image above, consequences with low opacity are not taken into account in the assessment, either due to a lack of data or because of excessive uncertainty.
Results
Direct effects: AI solution
As is usually the case with this type of assessment, the environmental footprint of the AI solution is relatively low compared with other indirect impacts, at around 388 kgCO₂e per year per site, at an annual cost of €1,500 per year.
| GWP (kgCO2e) | ADPe (kgSbe) | ADPf (MJ) | WU (m3) | |
|---|---|---|---|---|
| Forecast -- Training | 144.97 | 0.003 | 2145.62 | 45.96 |
| Forecast -- Inference | 144.97 | 0.003 | 2145.62 | 45.96 |
| Optimization -- Inference | 96.65 | 0.002 | 1430.41 | 30.64 |
| Storage | 0.75 | 0.000 | 10.38 | 0.32 |
| Fixed network use | 0.03 | 0.000 | 1.88 | 0.02 |
| TOTAL per site per year | 387.36 | 0.008 | 5733.91 | 122.91 |
Indirect effects
The main consequence of the AI solution controlling the microgrid is a change in the import and export of electricity to and from the local grid, based on a forecast taking into account the weather, electricity tariffs and the nature of the energy mix. This adjustment meets the solution’s primary objective: to reduce energy costs.
However, this behaviour only yields a net environmental benefit at 3 out of 11 sites during the period studied. This surprising result is due to the nature of the electricity grids within which the microgrids operate. The most striking example is one of the Californian sites. During periods of negative prices, the solution prefers to consume electricity from the grid as it makes money doing so. At peak consumption times, the solution sells part of its stored electricity at a high price and imports electricity at night when the energy mix is more carbon-intensive (gas-fired power stations).
| Net imported energy (MWh) | Net exported energy (MWh) | Net carbon impact (tCO2e) | |
|---|---|---|---|
| 1-AUS | 4,507 | -122 | -290 |
| 2-CZ | 4,591 | 523 | 1,100 |
| 3-FR | 12,355 | 14,726 | -21 |
| 4-FR | 16,607 | 9,012 | 140 |
| 5-BE | 26,485 | 18,403 | 170 |
| 6-BE | 2,536 | 2,799 | -7 |
| 7-US-CAL | 132,852 | 70,496 | 1,300 |
| 8-US-CAL | 84,498 | 48,740 | 3,000 |
| 9-US-CAL | 17,223 | 9,169 | 1,400 |
| 10-US-NW | -1,036 | -38,103 | 5,800 |
| 11-US-NW | 41,923 | -19,143 | 9,300 |
| TOTAL | 21,893 |
The second consequence we have quantified is the potential reduction in battery lifespan associated with more frequent micro-cycles. However, the results show that the effect is very small.
Net impacts
The solution examined under the conditions of this assessment shows a greater environmental impact across all indicators compared with the baseline scenario. The reduction in energy costs produces counterintuitive effects depending on the pricing policies of local grids and their energy mix. It is this consequence that requires our attention.
| GWP (kgCO2e) | ADPe (kgSbe) | ADPf (MJ) | WU (m3) | |
|---|---|---|---|---|
| AI solution | 3.96E+03 | 7.91E-02 | 5.85E+04 | 1.26E+03 |
| Power substitution | 2.19E+07 | 2.49E+02 | 5.17E+08 | 2.22E+07 |
| Battery use evol. | 5.09E+01 | 3.22E-03 | 6.02E+02 | 1.22E+00 |
| TOTAL | 2.19E+07 | 2.49E+02 | 5.17E+08 | 2.22E+07 |
We took the analysis a step further by examining three specific cases: the top-performing site (in South Australia), the neutral site (in France), and the worst-performing site (in California).
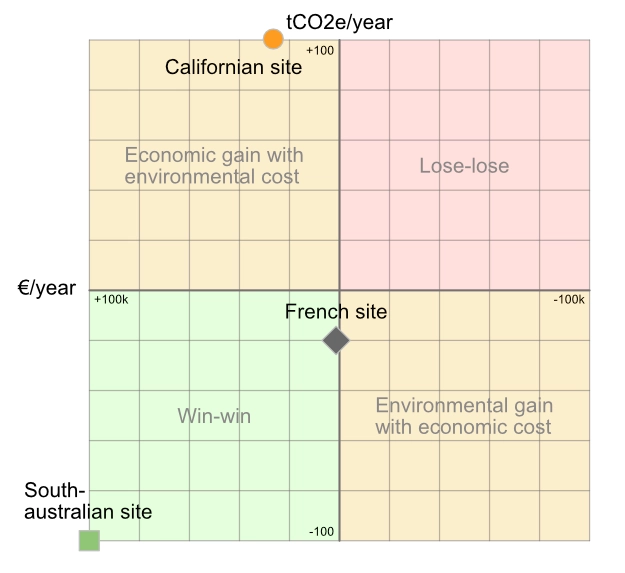
This analysis is set out in detail in the white paper produced by Schneider Electric, as well as in the conference paper written following this research.
Determining favorable conditions
Based on our analysis of the various sites, we have identified and prioritised the most important levers for maximising positive outcomes and minimising negative ones.
| Condition | Role | Policy lever |
|---|---|---|
| 1. Tariff alignment | Necessary | Carbon tax, dynamic pricing |
| 2. Local flexibility | Amplifier | Infrastructure investment |
| 3. Supportive regulation | Contributor | Market regulation |
| 4. Carbon-informed data | Technical enabler | Data infrastructure |
| 5. Multi-objective optim. | Algorithm fix | Software development |
Tariff alignment: electricity tariffs should translate real-time carbon intensity into price signals through instruments such as carbon-indexed tariffs or dynamic CO2 pricing.
Local flexibility: microgrids require minimum thresholds of on-site renewable capacity and storage to enable meaningful substitution during high-carbon periods.
Supportive regulation: regulatory frameworks that reward peak shaving, reactive power provision, or self-consumption transform local optimization into system-level benefit.
Carbon-informed data: high-frequency CO2-intensity data allow algorithms to internalize emissions within their control logic.
Multi-objective optimization: Hybrid optimization approaches that jointly minimize cost and carbon can deliver environmental gains at marginal economic trade-offs.
Epilogue
This assessment was the result of a fruitful collaboration and a shared passion between the teams at Hubblo and Schneider Electric. We are not satisfied with the results presented; rather, they have provided food for thought on many fronts. This assessment has revealed an environmental impact that had previously gone unnoticed (as it had not been quantified), as it was assumed that economic gains would automatically lead to environmental benefits.
We presented this work as a conference paper at ICT4S, the leading conference in this field of research, and we were honoured to win the Best Runner-Up Paper award. A wonderful achievement for Schneider Electric and Hubblo.