Key facts about the water footprint of data centers—What are we talking about? When? How? How Much?
Discussions about data centers water consumption have taken various turns in recent years, but have not converged into a constructive debate based on factual and shared landmarks. This article is here to help you navigate the topic.
Par Benoit Petit
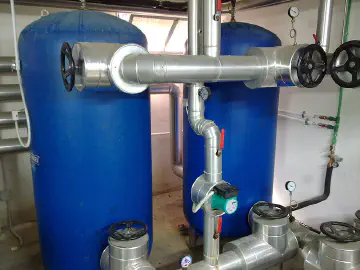
Picture of chiller water tanks in a data center, by Seeweb, licensed under CC BY-SA 2.0.
I would like to thank the following people for proofreading and providing suggestions: Cécile Diguet, Eric Fourboul, David Ekchajzer, Nicolas Celnik, Gauthier Roussilhe and Béatrice Dromard
Discussions about data centers water consumption have taken various turns in recent years, but have not converged into a constructive debate based on factual and shared reference points.
Exaggerations on the one hand and downplaying on the other—often based on unstated differences in methodology or scope—prevent us from having a constructive debate and achieving a better collective understanding of the subject.
We need to move beyond this binary “a lot/not much” approach. This topic requires consideration of several dimensions, which we will attempt to clarify in this article:
- General principles and definitions: notably the difference between water withdrawals and water consumption
- Regarding water withdrawal and water consumption
- the various categories of water use in a data center and the typical orders of magnitude for each category
- The concept of the severity of water withdrawals and consumption, which depends on location and seasonality
- Regarding the discharge of unused water after withdrawal: under what conditions and with what effects?
This article has been written with a French perspective, as a country where the government pushes to attract more new data centers projects, doubled by the recent EU project for AI giga factories, while seeing more and more alarming data coming from the largest facilities in the US.
General principles and definitions
When is water considered “consumed” or “withdrawn”?
Withdrawn water is not necessarily consumed in its entirety; some of it may be discharged and, under most methods, will not be counted as consumed.
The difference between water withdrawn and water consumed can be significant. To illustrate this—and before focusing on the case of data centers—the graph below, taken from the newspaper Le Monde1, shows water abstraction volumes by sector in dark blue and consumption in light blue, at the national level in France.
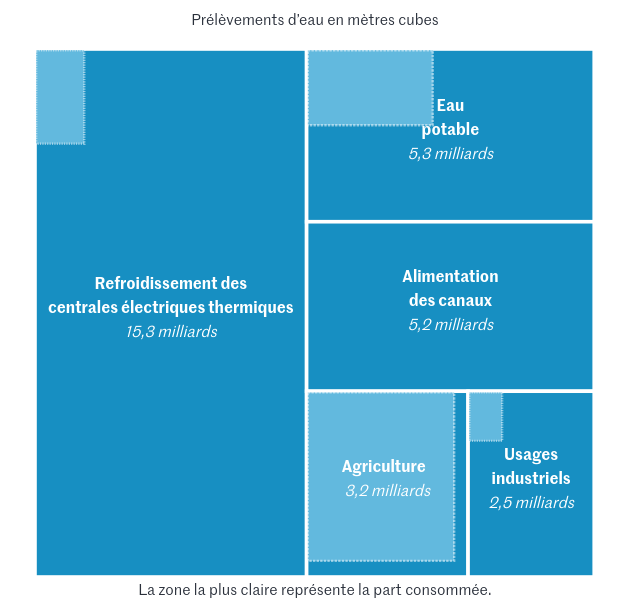
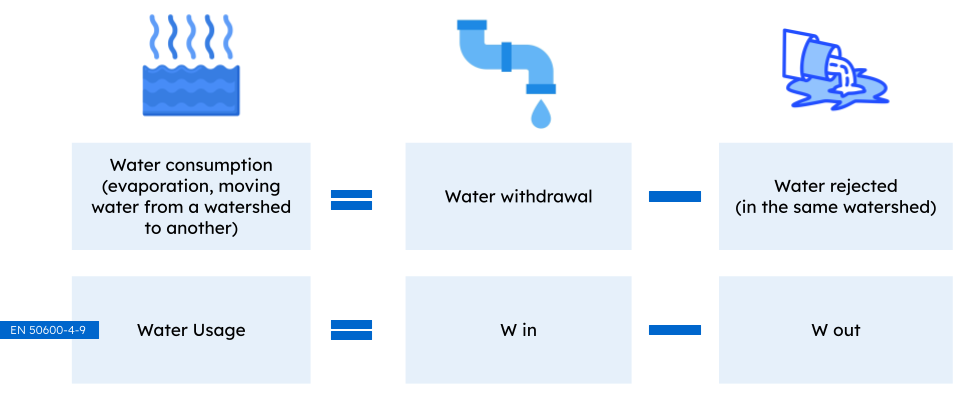
In Life Cycle Assessment, water is considered consumed when it leaves the watershed2. In the case of a data center, the water consumed for cooling is the water that evaporates during its use3. The remaining water that has not evaporated, once discharged back into the same watershed (assuming it is indeed discharged at the same location), is not considered consumed. The amount of water consumed therefore corresponds to water withdrawn minus water discharged.
The WUE—an indicator of water consumption relative to electricity consumption in a data center, which we will discuss in more detail later in this article—is also calculated by taking into account the difference between water withdrawn and water discharged.
How is a water footprint generally assessed?
The standard that defines the method for calculating the water footprint in Life Cycle Assessment is, to date, ISO 140464, the latest version of which was released in 2014 and then revised and validated in 2020.
It distinguishes between:
- indicators of water quantity, used to report volumes of withdrawal, consumption, or discharge
- water quality indicators, used to report any degradation of the water discharged as a result of a product or service.
This standard considers a water footprint to be comprehensive if it is calculated by taking into account all relevant aspects in terms of impacts on ecosystems, human health, and resources, which involves assessing the degradation of discharged water in addition to consumed or evaporated water. If the assessment of this footprint does not include one of these aspects, it is considered non-comprehensive.
It also distinguishes between:
- a single-criterion water footprint, where the assessment is purely quantitative and therefore focuses solely on water consumption volumes, whether weighted or not
- a multi-criteria water footprint, which includes, in addition to the quantitative aspect, qualitative indicators reflecting water pollution
Let’s state this up front: to date, you will not find any study proposing a comprehensive water footprint—as defined by ISO 14046—for data centers. It is also very rare to find studies considered multi-criteria within the meaning of ISO 14046, since the overwhelming majority include only quantitative data.
We’ll see later in this article that the situation is far worse than mere incompleteness from the standard’s perspective when it comes to available data—particularly public data.
Water consumption
What are the sources of water consumption in a data center?
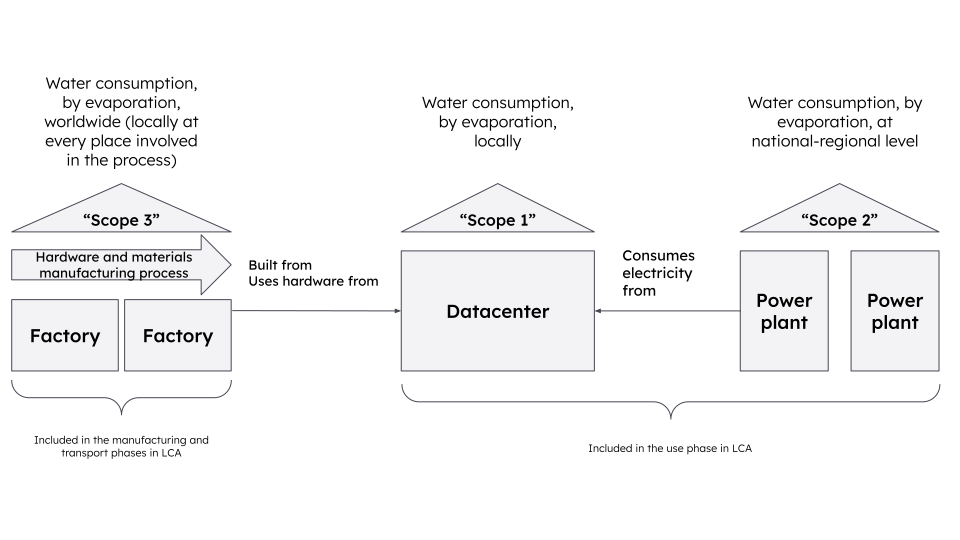
The debate focuses primarily on water consumption due to cooling in data centers, but this represents only a portion of the water consumption involved in operating a data center.
A data center’s water consumption also includes:
- water consumption resulting from the generation of the electricity consumed (evaporation from hydroelectric dam reservoirs, cooling of thermal power plants, etc.). This can be several times greater than the water consumption required for cooling.
- water consumption resulting from equipment production (building construction materials, IT equipment, non-IT equipment for cooling, power supply, security, etc.)
In fact, depending on the cooling technologies used and the size of the data center, water consumption for these other two areas can be several times greater than that required for cooling.
Note: The overwhelming majority of water consumed by data centers in France is drinkable water sourced from the public water supply 5. This is also the case internationally 6.
Let’s now try to clarify these three categories of consumption.
1. Cooling and related activities (local consumption, at the data center level)
A data center’s local water consumption is primarily due to the system that cools IT equipment in clean rooms (rooms dedicated to housing server racks containing the equipment).
Other necessary activities or those related to the data center may also result in local consumption, but to a lesser extent; for example: “air treatment, cleaning and watering of technical equipment, employee restrooms, or company cafeterias” (source: ARCEP 5).
In this chapter, we will focus primarily on cooling and take a step back to examine the system as a whole.
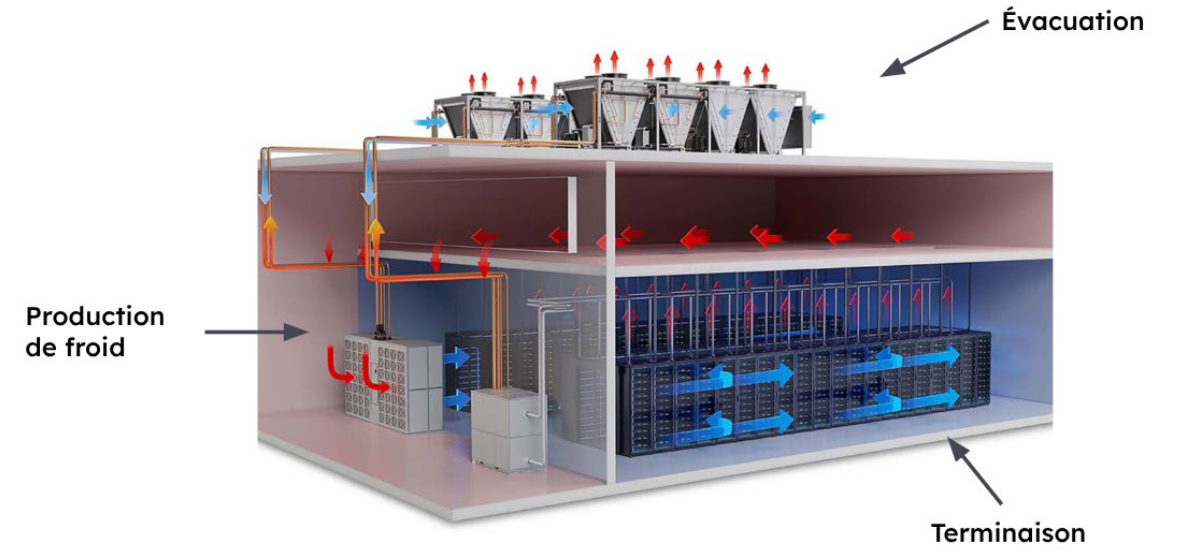
The illustration7 above provides an overview of a data center’s cooling system and introduces its three main components, which we’ll arbitrarily name here for simplicity:
- the cooling termination—which everyone is familiar with—that extracts heat from the equipment and cools it directly within the IT rooms
- cooling generation: a set of systems responsible for providing cooling, either in the form of cold air or cold water (sometimes this component may be installed outdoors, contrary to what the diagram shows)
- Exhaust: the external part of the cooling system, which either expels hot air outdoors, cools liquid from the data center that is to be returned to it, cools hot air (using water, for example), or, in some cases, connects to a district heating network if applicable8.
It is the external part of a data center’s cooling system that must be examined with regard to water consumption, as this is where evaporative systems such as cooling towers or adiabatic systems are located.
Various solutions exist for each of these components. Here, we will exclude systems that use oil baths at the system’s terminal stage (immersion cooling) because they are currently very uncommon and would require explanations that go beyond the scope of this article.
1.1 The Cooling System Termination
The cooling system termination—located in the IT rooms—does not necessarily use water or uses it in small quantities in a closed loop without evaporation.
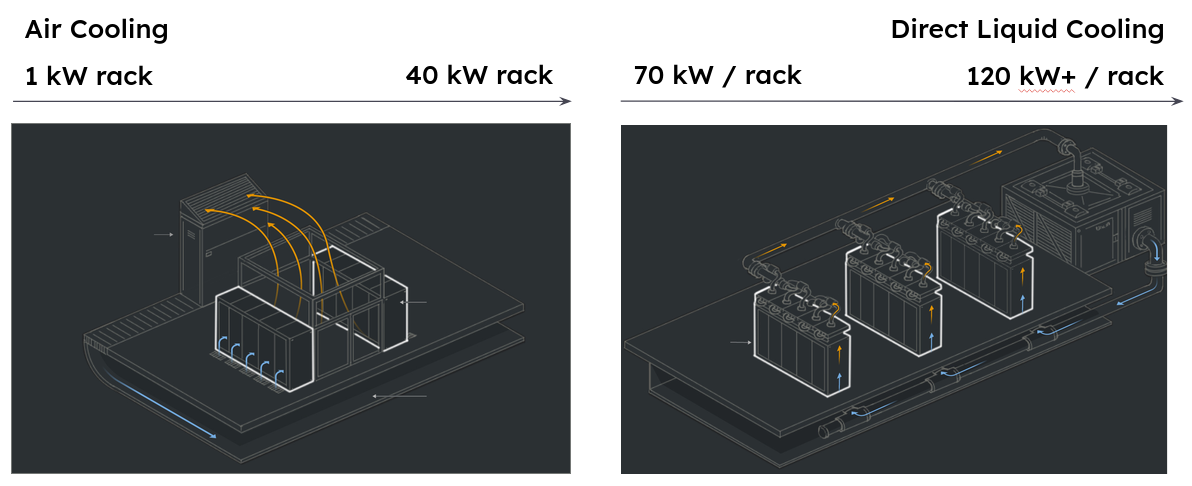
When Direct Liquid Cooling is preferred over air cooling, it should be noted that its use has no direct link to a data center’s water consumption through evaporation. Uncertainties remain regarding the draining of these circuits and the conditions of the associated discharges.
Long version
Regarding the termination, the conventional solution involves drawing in hot air and blowing cold air into the IT rooms to cool the equipment. This scenario does not involve any water consumption per se (though the rest of the system may, as discussed below). This solution becomes limited as the energy intensity of the equipment increases, which is the case for equipment dedicated to Generative AI. For this type of application, DLC, or “direct liquid cooling,” is most often used in combination with air cooling as a secondary method. This physical limit generally occurs at around several tens of kW of installed power in a rack—around 40 kW according to some industry players, as illustrated in the diagram above.
Contrary to what is sometimes reported, the water used for DLC actually accounts for the smallest portion of the total volume consumed for cooling. This water is usually contained in a closed loop and does not evaporate during the process.
However, many unknowns remain regarding the quantities (certainly small), the frequency of draining required, leaks, and above all, the discharge conditions and water pollution resulting from the drained water (we will return to this in the second part of the article). It should be noted that this water is often mixed with glycol, which is toxic if ingested by humans as well as fish. The issue of pollution from the discharged water is raised at the end of the article and will certainly be the subject of a second installment.
1.2 Refrigeration
Technologies used for cooling generally require only small amounts of water, particularly when they operate in closed-loop systems. While uncertainties remain regarding the conditions and frequency of draining this water as well as its contamination with glycol or other substances, this aspect is, in principle, negligible in terms of volume compared to technologies used outside the building.
Several cooling technologies exist, and some are typically combined. The following table is based on recent ADEME studies on the subject 9 10.
Some of these systems require the installation of equipment outside the building (which we discuss in the following section).
| Category | Subcategory | Variations |
|---|---|---|
| Cooling | Shared cooling (with chilled water loop) | Air-cooled chillers |
| Water-cooled chillers | ||
| Cooling | Integrated/standalone cooling (with refrigerant) | Direct expansion into the air |
| Indirect expansion into (hot) water | ||
| “No” cooling (to be combined with another cooling technology) | Free cooling | Direct air |
| Indirect air-cooled (with heat exchanger) | ||
| “Non-production” of cooling (to be combined with another cooling production technology) | Free-chilling | using outdoor air (water/outdoor air energy exchange) |
| Geo-cooling | Using groundwater | |
| Geo-cooling | Via a closed loop | |
| River-cooling | ||
| Sea-cooling | ||
| Adiabatic (to be combined with free-cooling or free-chilling) | Adiabatic | Combined with free-cooling |
| Adiabatic | Combined with free-chilling |
Long version
The study on cooling techniques in French data centers, conducted by Critial Building for ADEME, as well as the first part of the prospective study on data center energy consumption, to which Hubblo contributed, will provide you with more details 9 10.
The key takeaway is that, in most cases in France, when water is used in this context, it is contained in a secondary “loop” and helps cool the primary loop (DLC) or, in the case of air cooling, cools the air circulating in the IT room.
Most of the time, the water used for cooling is in a closed loop, so in principle little water is consumed at this stage, but the uncertainties mentioned in 1.1 also apply here.
1.3 The External Component of the Cooling System
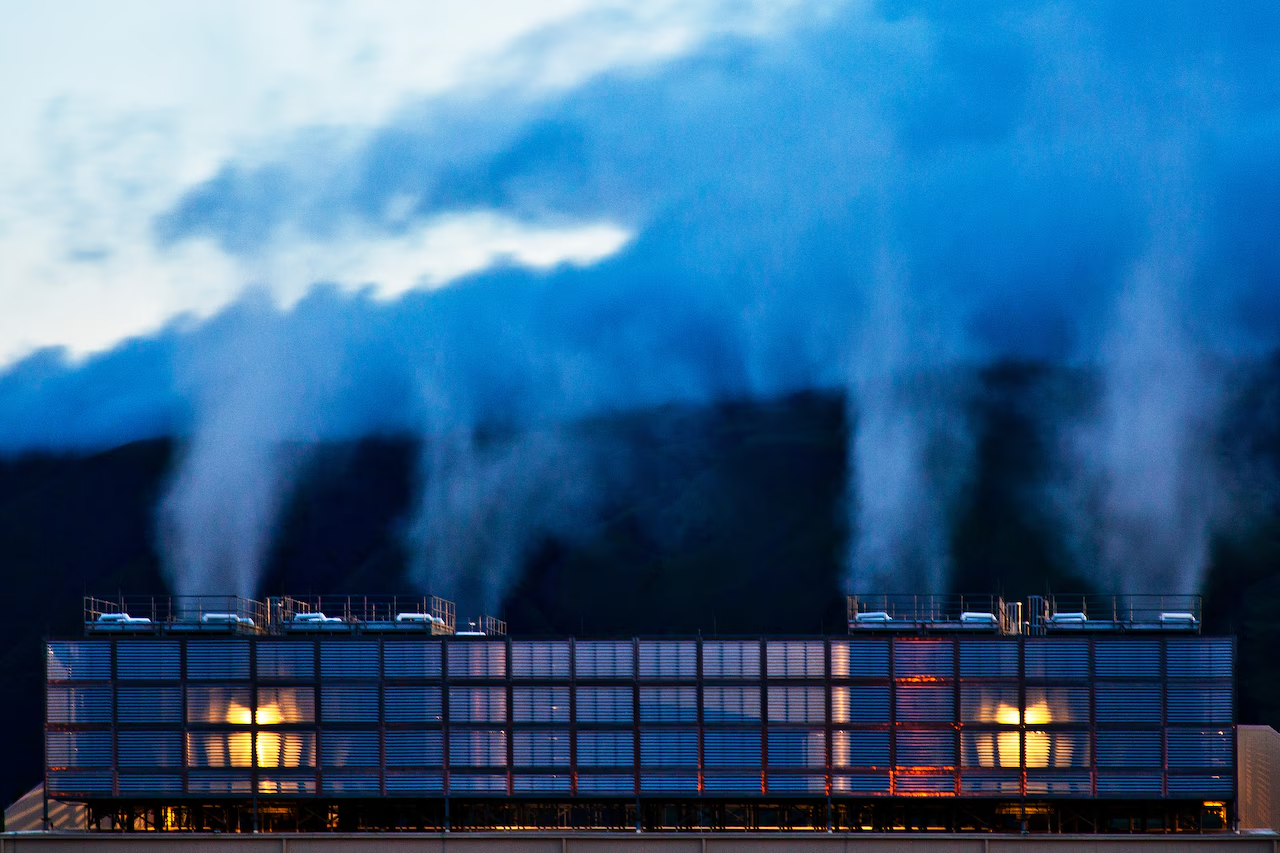
Cooling towers and adiabatic cooling are evaporative technologies. The former is widely used in the U.S. and very rarely in France, which explains why water intensity is currently much higher in American data centers than in France.
However, despite lower volumes in France, water remains a local issue, and the severity of consumption must be weighed against water stress.
Mentioning the low volumes consumed in France for cooling, without addressing Parts 2 and 3 explained later in this article (which are more significant than cooling in terms of volume), or without explaining that even a small volume of water withdrawn and consumed in an area with high water stress remains a problem, is an omission that stems either from a lack of understanding of the subject or from a deliberate falsehood.
Long version
This is where it all comes down to when it comes to water evaporation. The most notable examples of evaporative technologies are evaporative cooling towers (or air-cooled cooling towers) and adiabatic cooling.
Evaporative cooling towers are not widely used in France, largely due to regulations: air-cooled cooling towers are classified as Installations Classified for Environmental Protection (ICPE), under section 2921 of the Environmental Code. Depending on the thermal capacity of the facility to be equipped with TARs, the requirements range from simply filing a declaration to obtaining explicit authorization for facilities exceeding 20 MW. This added complexity has contributed to steering the French data center fleet toward solutions not subject to this regulatory requirement.
Adiabatic cooling, which can be either closed-loop or open-loop, does consume water, but generally less than cooling towers.
As explained above, the key distinction is that there are currently very few data centers in France equipped with TARs, whereas these systems are widespread in the U.S.—which explains the higher reported water consumption for generative AI cooling, since the U.S. currently hosts far more data centers specialized for this purpose.
ARCEP estimates, for example, that for 2024 11 in France, for 160 data centers (just under half of the known fleet 12), 573,000 m³ of water will have been withdrawn for “cooling data centers, air treatment (humidification), refilling closed-loop systems, or cleaning and flushing technical equipment, as well as for tertiary activities, such as employee restrooms or company cafeterias.” This volume is small compared to national water withdrawals (15.3 billion m³ for power plant cooling, 3.2 billion m³ for agriculture; see the diagram in the introduction). Water consumption is likely even lower and certainly so relative to consumption in other sectors (the light blue portion of the aforementioned diagram). This is likely still true even when considering the entire data center fleet in France to date (rather than just the 160 in the sample). However, we will see that this data is far from telling the whole story of water withdrawals and consumption attributable to data centers in France, and that this partial blind spot affects the entire world.
1.4 Reference points for local data center consumption
WUE (site)
Water Usage Effectiveness, or WUE, is an indicator of local consumption. In its most basic form, the “WUE(site)”, it provides an indication of water intensity per kWh of electricity consumed by IT equipment, using the following basic formula: WUE = WU / EIT where WU is the water consumed at the data center level and EIT is the electricity consumed by IT equipment (not the energy consumed by the entire building).
Note: Most WUE values displayed are site WUE values, meaning they refer only to the water consumed locally by the data center and not to the water required for electricity generation. The site WUE corresponds to Level 1 (“basic”) or Level 2 (“intermediate”) calculations as defined by the EN 50600-4-9 / ISO 30134-9 standard.
Attempt to compare WUE(site) values between france and the U.S.
In France the recent debates have been a lot about whether or not the water consumption figures regarding AI were unapplicable for local data centers, because new US datacenters are much bigger, some of them using cooling towers. Let’s see how France and the USA compare on this topic.
The table below attempts to compare known average WUE(site) values by combining data from:
- the “United States Data Center Energy Usage Report” by Shehabi et al. / Berkeley Lab in 2024, for WUE values in the U.S., on the one hand (which we will refer to as “LBNL 2024”) 13
- the study “Assessment of the Energy Performance and Sustainability of Data Centers in the EU: First Technical Report” by Borderstep, AIT, and EY in 2026, for European data (and specifically France), derived from data collected for the Energy Efficiency Directive 14
| EED categories | 100–500 kW | 500–1,000 kW | 1–2 MW | 2–10 MW | above 10 MW | above 10 MW | Colocation | Enterprise | |
|---|---|---|---|---|---|---|---|---|---|
| France average WUE | 0.037 | 0.433 | 0.169 | 0.204 | 0.341 | 0.341 | 0.264 | 0.278 | |
| LBNL categories | Small | Small | Midsize / Colocation | Midsize / Colocation | Midsize / Colocation | Hyperscale | Midsize / Colocation | AI Specialized | |
| U.S. average WUE (site) | 0.32 | 0.32 | 0.67 | 0.67 | 0.67 | 0.32 | 0.67 | 0.61 | |
| USA / France | x 8.64 | x 0.73 | x 3.96 | x 3.35 | x 1.96 | x 0.93 | x 2.54 |
The categories proposed by both sides do not correspond exactly, but this imperfect comparison has the merit of providing an order of magnitude for some of them.
Note that if we compare the 500–1,000 kW category in France to the “Small” category in the LBNL 2024 study, the averages presented do not allow us to conclude that data centers in the U.S. consume more water on-site than French data centers. This is also true when comparing facilities over 10 MW to the “Hyperscale” category, but this second exception is skewed since France currently has very few data centers that could be classified as “Hyperscale”.
Otherwise, the ratio is indeed higher for the U.S., between 1.96 and 8.64 times higher depending on the comparisons.
The “AI Specialized” and “Enterprise” categories have no equivalents in the opposing study.
2. Water consumption related to electricity generation (indirect consumption, localized but distributed at least nationwide)
This component is often several times greater15 than that of the entire cooling system in terms of volume.
Each power grid has, on average, a different water intensity, depending on the mix of technologies and primary energy sources used, just as is the case with carbon intensity. The World Resources Institute, for example, publishes a list of water intensity factors by country16 (and thus by electricity mix).
The differences depend on the composition of the electricity mix. Here are some key factors regarding the type of technology and primary energy source used:
- hydroelectric dams have the second-highest water intensity per kWh of electricity generated, after biomass
- Next come thermal power plants (coal, gas, nuclear) due to the cooling required
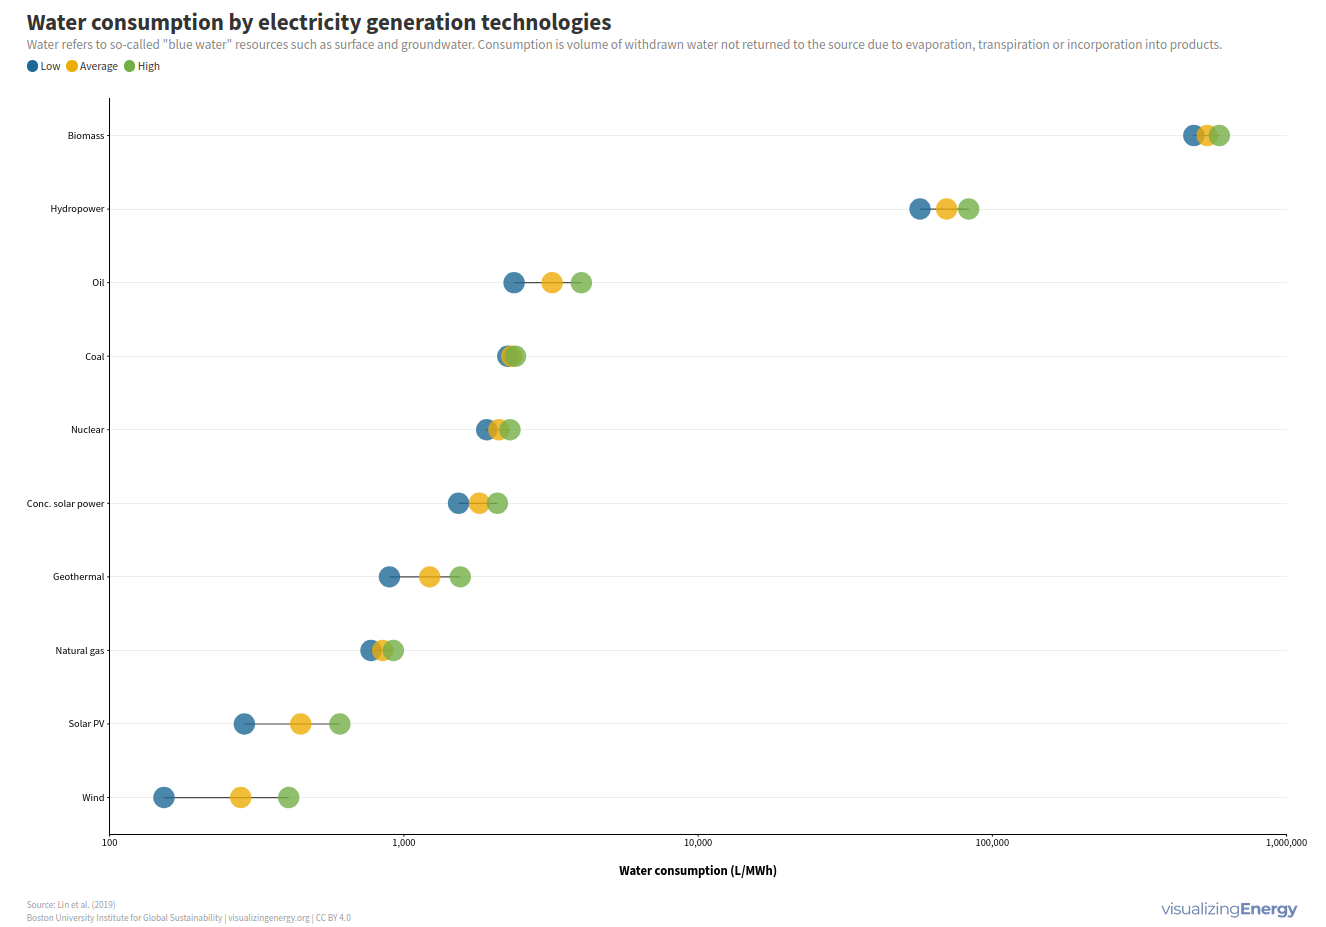
View the complete chart above by following this link: 17.
ARCEP also reports that for the 160 data centers studied in its 2024 survey: “the total volume of water withdrawn or consumed by data centers (direct + indirect consumption associated with electricity use) will increase by approximately 8% […] due to the significant rise in total electricity consumption by data centers in 2024, it is estimated at nearly 6.5 million m³, which is equivalent to the average annual water consumption in France for more than 100,000 people.”
These calculations apparently mix up withdrawal volumes and consumption volumes, which does not help with clarity, but this passage confirms that the volumes associated with electricity generation are indeed much higher than the volumes consumed locally in data centers. Thus, a (minority) portion of the water abstracted and consumed for cooling thermal power plants—as we saw in the introduction—is attributable to data centers, as is the case with consumption resulting from evaporation in hydroelectric dam reservoirs. Even if we piece together the complete picture of this water consumption for the data center sector, we will still lack a relative indicator of the “severity” of the water withdrawals and consumption. This is explained later in the article in the dedicated section.
Accounting for Water Consumption from Electricity Generation in the WUE (source)
WUE can represent the water intensity of electricity generation methods, based on the electricity consumed by IT equipment. This indicator corresponds to calculation level 3 as defined in standard 50600-4-9 / ISO-IEC 30134-9 and is sometimes referred to as “WUE(source)”.
It is important to distinguish between WUE (site) and WUE (source); the latter covers a much broader scope of consumption than the former.
3. Water consumption resulting from the manufacturing, transportation, and end-of-life of equipment (indirect consumption, occurring in multiple locations around the world)
This is the aspect most often overlooked when discussing a data center’s water footprint. Unlike the first scope of consumption, which can have direct local effects (exacerbation of water stress and its many possible consequences), as well as effects within the second scope (exacerbation of water stress in electricity generation facilities, and thus at least on a national scale), this third scope concerns water consumption—and thus water withdrawals—that occur at the various locations where raw materials are extracted, materials are manufactured, and equipment is assembled, meaning in multiple locations around the globe.
3.1 Manufacturing of IT and Non-IT Equipment
IT equipment has an impact on numerous environmental criteria. Regarding water consumption, the ADEME footprint database provides order-of-magnitude figures:
- “Small rack server (2023)”: 80.9 m³ per unit
- “Blade server (2023)”: 113 m³ per unit
- “Medium-sized rack server (2023)”: 284 m³ per unit
- “Large rack server (2023)”: 2,290 m³ per unit
This footprint includes, in particular, the extraction of raw materials, as well as the component etching process18.
Note: These values are weighted according to water stress using the AWARE method19. They are not raw consumption volume values, but rather a weighting of the impact of this consumption. The raw volumes consumed can range from 10 times higher to 100 times lower than the values shown. Weighting methods, such as AWARE, may be the subject of a future article.
3.2 Manufacturing of Materials and the Building
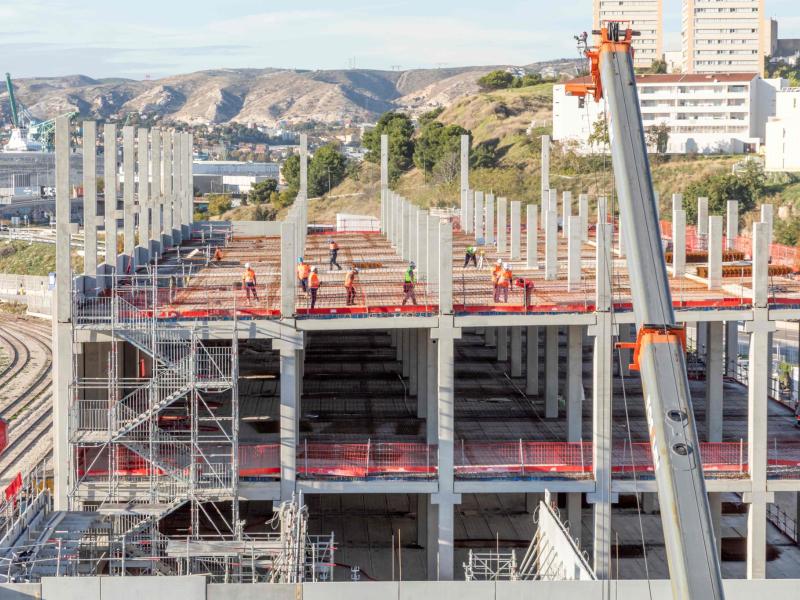
The manufacturing of the building and the materials it contains can quickly exceed 1/3 of a data center’s total energy consumption.
Long version
The construction of a building such as a data center involves multiple components, the production of which requires water consumption—some to a very significant extent. Concrete, for example, requires between 0.2 and 2.6 m³ of water per m³ of concrete produced 2021 (depending on the mix and assessment methods), although the scope of the assessments and the consideration of the product’s full life cycle appear to vary from one study to another 22. Steel, too, requires around 7 L/kg of steel produced 23.
Data4 estimates, for example 24, that for a data center in France with a total area of 4,278 m², an IT power capacity of 5 MW, and a structure “comprising nearly 5,200 m³ of concrete and 500 metric tons of steel, and 3,868 m² of insulation and 5,880 m² of waterproofed roofs,” that 35% of total water consumption over its entire life cycle (20 years) stems from the manufacturing of equipment and materials. Their study also points out that 38.8% of total water consumption is attributable to the building itself, of which approximately 81% is related to the load-bearing structure (steel and concrete).
Severity of water withdrawal and consumption
Water consumption is a volume-based indicator, whereas the severity of this consumption depends on local factors. The impacts of consuming 1 L of water depend in particular on the water stress in the area in question. This water stress, for a given area, varies throughout the year (seasonality).
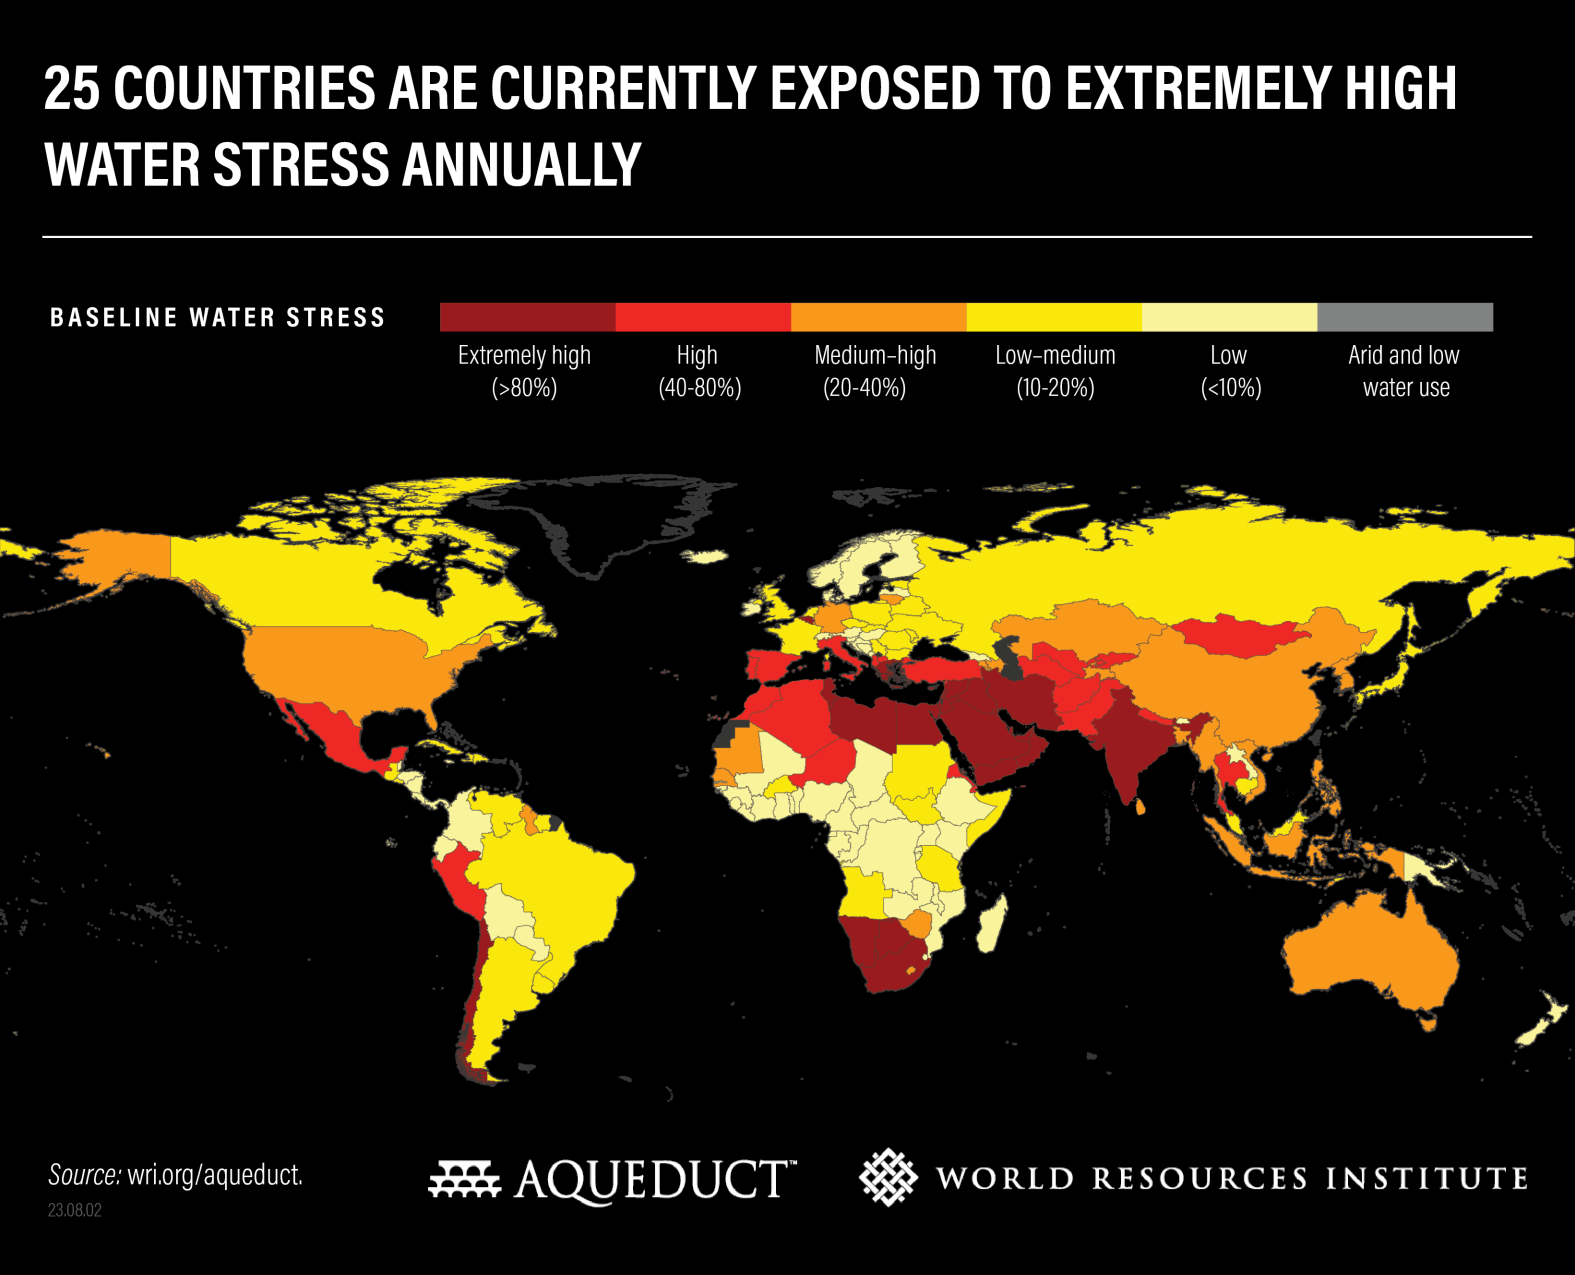
(A dynamic, updated version of the map above, provided by the WRI, is also available. 25)
Long version
The finer the geographic resolution, the more nuances of water stress become apparent. It is therefore necessary to examine water consumption attributable to a data center on a geographic basis, cross-referencing it with local water stress data to understand its potential effects: for cooling locally, due to electricity consumed at production facilities, and at locations involved in the manufacturing of equipment and materials. Recent studies are beginning to address this issue by taking Scopes 1 and 2 into account 26 27, but not Scope 3 at this time.
The severity of consumption also varies over time, since water stress fluctuates seasonally. For greater completeness and precision in studies on this topic, a geographic quantification would ideally be required, taking into account the three consumption scopes mentioned above, weighted by location, time, and associated water stress.
Note that ISO 14046 requires that consumption volumes be weighted according to water stress, even for a single-criterion water footprint (one that includes no indicators other than volumes).
After withdrawal and consumption, discharges: under what conditions? What are the effects?
In addition to the volumes consumed and impacts related to water stress, we must also consider the effects of discharging water that has been abstracted but not consumed.
Several factors can affect the environment in this regard:
- the timing of discharge: water is not necessarily returned to its source shortly after withdrawal, exacerbating water stress—albeit temporarily—but still having effects on flora and fauna
- pollution in the discharged water
- the temperature of the discharged water: depending on the environment into which it is discharged, warmed water can disrupt the ecosystem
- the discharge location: discharged water is not always returned to its original environment. Practices in this regard are difficult to track and assess. Some of the water not accounted for as consumed may in fact be considered consumed from the perspective of the original watershed.
ISO 14046 recommends assessing the impacts of both water withdrawal and consumption, as well as pollution and the conditions under which unused water is discharged, on human health, ecosystems, and water resources available to future generations. Given the lack of available data to systematically extend assessments to this level of detail, the standard does not specify the nature of these indicators.
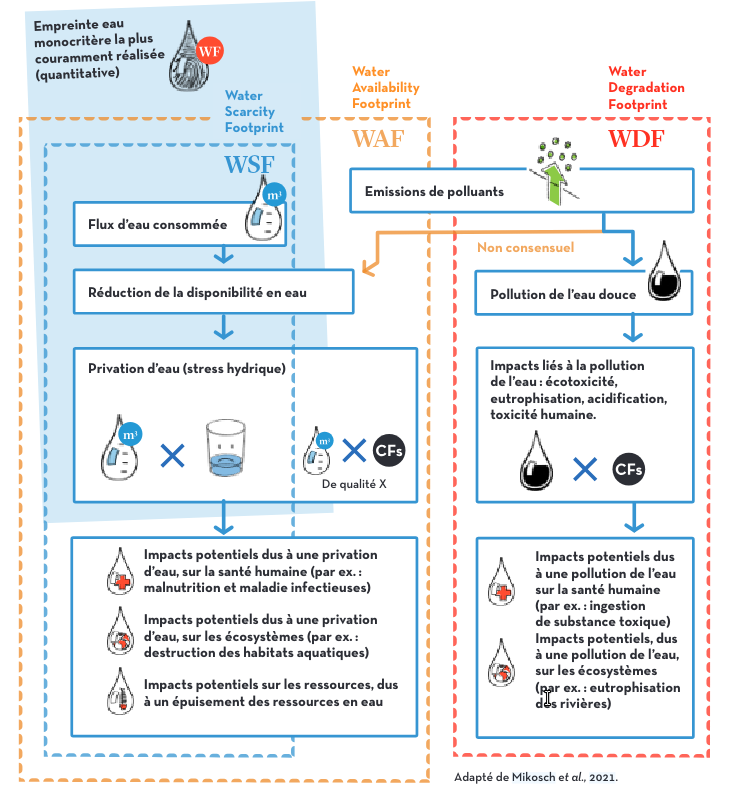
In a 2021 study, Natalia Mikosh and Markus Berger28 introduced a method to quantify the effects of water consumption volumes and the conditions and pollution levels of discharged water, using the Water Scarcity Footprint (WSF), the Water Availability Footprint (WAF), and the Water Degradation Footprint (WDF). This framework, reproduced below from the water handbook29 cited earlier in this article, shows promise. However, data needed to address the issue of water degradation are difficult to access.
In Life Cycle Assessment, other indicators allow us to evaluate some of the effects of consumption, discharges, and pollution on the biosphere, in addition to the Water Use indicator:
- Eutrophication of freshwater
- Eutrophication of the marine environment
- Ecotoxicity of freshwater
These concepts and their connection to data centers may be the subject of a future article.
Conclusion
A still glaring lack of transparency, a missing “Scope 3,” and calculation methods self-declared by Big Tech
The issue of access to data center water usage data has seen a slight improvement with the publication of the first data collected under the EU Energy Efficiency Directive. The Borderstep study cited above provides average PUE and WUE (site) values by data center category and by country14. This is a first step toward facilitating estimates, at least for Scope 1 and 2. Furthermore, companies’ non-financial data sometimes provide Scope 1 figures30.
However, as we have seen, “Scope 2” data is still too rarely calculated, and the water footprint of equipment manufacturing and building construction (“Scope 3”), which is very significant, is still absent from published data.
The scale of water consumption associated with electricity generation should be considered in relation to the overall electricity consumption of data centers—an indicator whose growth is well documented elsewhere.
At the same time, the construction of new data centers has surpassed office construction in terms of monetary expenditure in the U.S.31, which hints at the trend regarding “Scope 3” water consumption.
The gap left by international regulations regarding the disclosure of tech companies’ water footprints also leads to confusing practices. For example, “water-positive” or “water replenishment” commitments promise to restore water consumption through the development of “positive” projects related to this metric. This is somewhat equivalent to carbon offset projects, which the literature clearly shows to be ineffective, if not counterproductive. When it comes to water, the principle is even more flawed. As we’ve seen in this article, the impact of water consumption is local; claiming to restore what has been lost in one watershed by maintaining a wetland elsewhere makes no sense.
The primary driver of overconsumption: scale
When we add the trend in construction to the rapid pace of new hardware technologies deployed for AI in data centers, the gap between our understanding of the issue and the curve of its impacts only widens. We are currently unable to fully map the water footprint of French data centers (the DCWatch project will, however, provide some answers by the end of 2026 32).
What is certain, however, is that the race to build giant data centers (ranging from several hundred MW to several GW of power) is the main driver behind the increase in this footprint. The debate has so far focused heavily on local consumption (“Scope 1”) and the discrepancy between France and the U.S. regarding available data.
Building a data center or a campus of giant data centers—even if cooled without evaporative technology, as is the case for the initial phases of the Fouju Campus IA project 33—already guarantees a water footprint far greater than the average for French data centers (due to Scope 2 and 3 emissions).
We will not be able to seriously address the issue of water until we include the scale of these projects and the justification for their massive size in the debate.
A Systemic Issue
This is a systemic issue, since the behavior of a data center’s cooling system also depends on outdoor temperature and air humidity—and thus on the local climate. Research is advancing to better predict the actual energy consumption of data centers based not only on their characteristics but also on these specific local climate data34.
Example: Installing a data center in an arid region—and thus one with high water stress—often coincides with a hotter climate, which requires more cooling without the ability to benefit from free cooling due to the outdoor temperature.
This implies either:
- consuming more electricity for cooling, thereby indirectly placing greater strain on thermal power plants, which also require water for cooling (although they are not necessarily located in an area subject to the same water stress)
- relying more heavily on water for cooling to limit electricity consumption, which results in water use that has a significant environmental impact due to water stress
The equation for optimizing water consumption is therefore complex because it sometimes conflicts with that of energy; it does not resolve the issue of potential pollution and discharges, nor does it eliminate the need for realistic local policies and regulations to conserve water, which will become increasingly scarce as droughts become more frequent, including in European countries.
However, there is a simple, two-pronged solution that addresses all aspects of both water consumption and disruption to the water cycle.
The first level consists of reducing energy consumption in existing data centers and those planned for construction. This is achieved, on the one hand, through eco-design, which must include a reassessment of needs to align with actual demand (even though this pillar of eco-design is often overlooked).
This reduces not only the water consumption required for cooling but also that associated with electricity generation—which is currently the fastest-growing component, particularly due to generative AI.
The second approach involves extending the lifespan of equipment and materials. This means reducing the number of equipment replacements over the building’s entire lifespan to limit the water footprint associated with their manufacturing. It also involves regulating the installation of data centers in areas with severe water stress, as well as reusing brownfield sites and existing buildings rather than constructing new ones on undeveloped land.
As you can see, the most effective solution for reducing water consumption in data centers is conservation, starting with the design phase and, if possible, the planning phase.
References
How much water is withdrawn and consumed by the population, factories, and agriculture in France? Les Décodeurs, Le Monde, 2023 ↩︎
Watershed (Wikipedia): “A watershed is a geographic area where rainwater (catchment area) is collected through runoff or infiltration by a watercourse and its tributaries, or by a body of water (lake, marsh, sea). This surface and groundwater flows by gravity and converges at a single point.” ↩︎
For other activities, this could involve incorporation into a finished product, transfer to another watershed, or evapotranspiration. See the water handbook. ↩︎
page 33, Annual Surveys “Toward a Sustainable Digital Future,” ARCEP, 2024 ↩︎ ↩︎
Illustration based on an original image by AccuSpec, from the ADEME study on the 2024–2060 outlook for data center energy consumption in France ↩︎
See this video from DCMag, presenting the cooling system of a data center connected to the district heating network in Valenciennes ↩︎
ADEME study on data center cooling ↩︎ ↩︎
Chapter “Cooling Techniques” from the ADEME study “2024–2060 Outlook for Data Center Energy Consumption in France” ↩︎ ↩︎
Annual surveys “for sustainable digital technology,” ARCEP, 2024 ↩︎
United States Data Center Energy Usage Report, Shehabi A., Smith S., Sartor D., Brown R., Herrlin M., Berkeley Lab, 2024 ↩︎
Assessment of the Energy Performance and Sustainability of Data Centers in the EU: First Technical Report, Australian Institute of Technology, Borderstep, EY, 2026 ↩︎ ↩︎
Water consumption by electricity generation technologies, Visualizing Energy ↩︎
Roussilhe, G., Pirson, T., Xhonneux, M., & Bol, D. (2024) From silicon shield to carbon lock-in? The environmental footprint of electronic components manufacturing in Taiwan (2015–2020) ↩︎
Global Concrete Water Footprint, Yazmin Lisbeth Mack Vergara, Vanderley Moacyr John, 2019 ↩︎
Life cycle water inventory in concrete production—A review, Yazmin L. Mack-Vergara, Vanderley M. John, 2017 ↩︎
Life-cycle inventory analysis of concrete production: A critical review, A. Petek Gursel, Eric Masanet, Arpad Horvath, Alex Stadel, 2014 ↩︎
Data4 White Paper on the Life Cycle Assessment of a Data Center in France—“Measuring to Take Better Action,” 2025 ↩︎
The Hidden Water Geography of U.S. Hyperscale Data
Centers in the AI Era, Gianluca Guidi, Francesca Dominici, 2026 ↩︎Geospatial Assessment of Water Footprints for Hyperscale Data Centers in the United States, Nuoa Lei, Jun Lu, Zhu Cheng, Zhi Cao, Arman Shehabi, Eric Masanet, 2023 ↩︎
Addressing Water Quality in Water Footprinting: Current Status, Methods, and Limitations, Natalia Mikosch, Markus Berger, 2021 ↩︎
The Water Footprint: A Visual Guide, based on ISO 14046 – ELSAPACT and Minimeau, 2021 ↩︎
U.S. Census Bureau, 2025 ↩︎
Climate and technology-specific PUE and WUE estimates for U.S. data centers using a hybrid statistical and thermodynamics-based approach, Nuoa Lei, Eric Masanet, 2025 ↩︎